The team at Signal Savvy Investor (SSI) is officially ending a long break from publishing. The site has been quiet since mid-2025, but that’s because we’ve been busy making a proprietary stock selection and data visualisation platform initially for the Australian market.
We’re now in the last stages of developing the SSI Platform and getting ready to roll it out to the public!
Moving from Commentary to Platform Capability
For some time, SSI has given retail investors information about the market and educational materials. But we saw that our readers kept running into the same problem: the “implementation gap.” Even if they know a lot about how the market works, beginner and intermediate investors often have a hard time narrowing down the 2,000+ companies listed on the ASX to a manageable list that fits their risk profile.
Instead of making one-time articles, we used our resources to create a technical solution that automates the hard work of finding stocks.
Data Integration: More Than Just the Balance Sheet
The new SSI platform is based on the idea that traditional financial metrics, while still important, are no longer enough to give you an edge. The new engine finds stocks that do well by combining information from two different groups:
- Basic Principles
The platform gets real-time information about P/E ratios, debt-to-equity ratios, dividend yields, and past earnings growth. This makes sure that any “signal” found is based on good financial health. - Unusual Market Signals
The platform combines different data sources to give a more complete picture . This includes:- Sentiment Analysis
- Macro Correlation
- Alternative Momentum
Targeted Discovery for Investors in Australia
We know that a “best performing stock” for a 25-year-old growth investor is very different from one that is good for a retiree who wants franked dividends.
Users can enter their specific investing goals, like capital preservation, aggressive growth, or consistent yield, and the platform will filter the ASX through those goals.
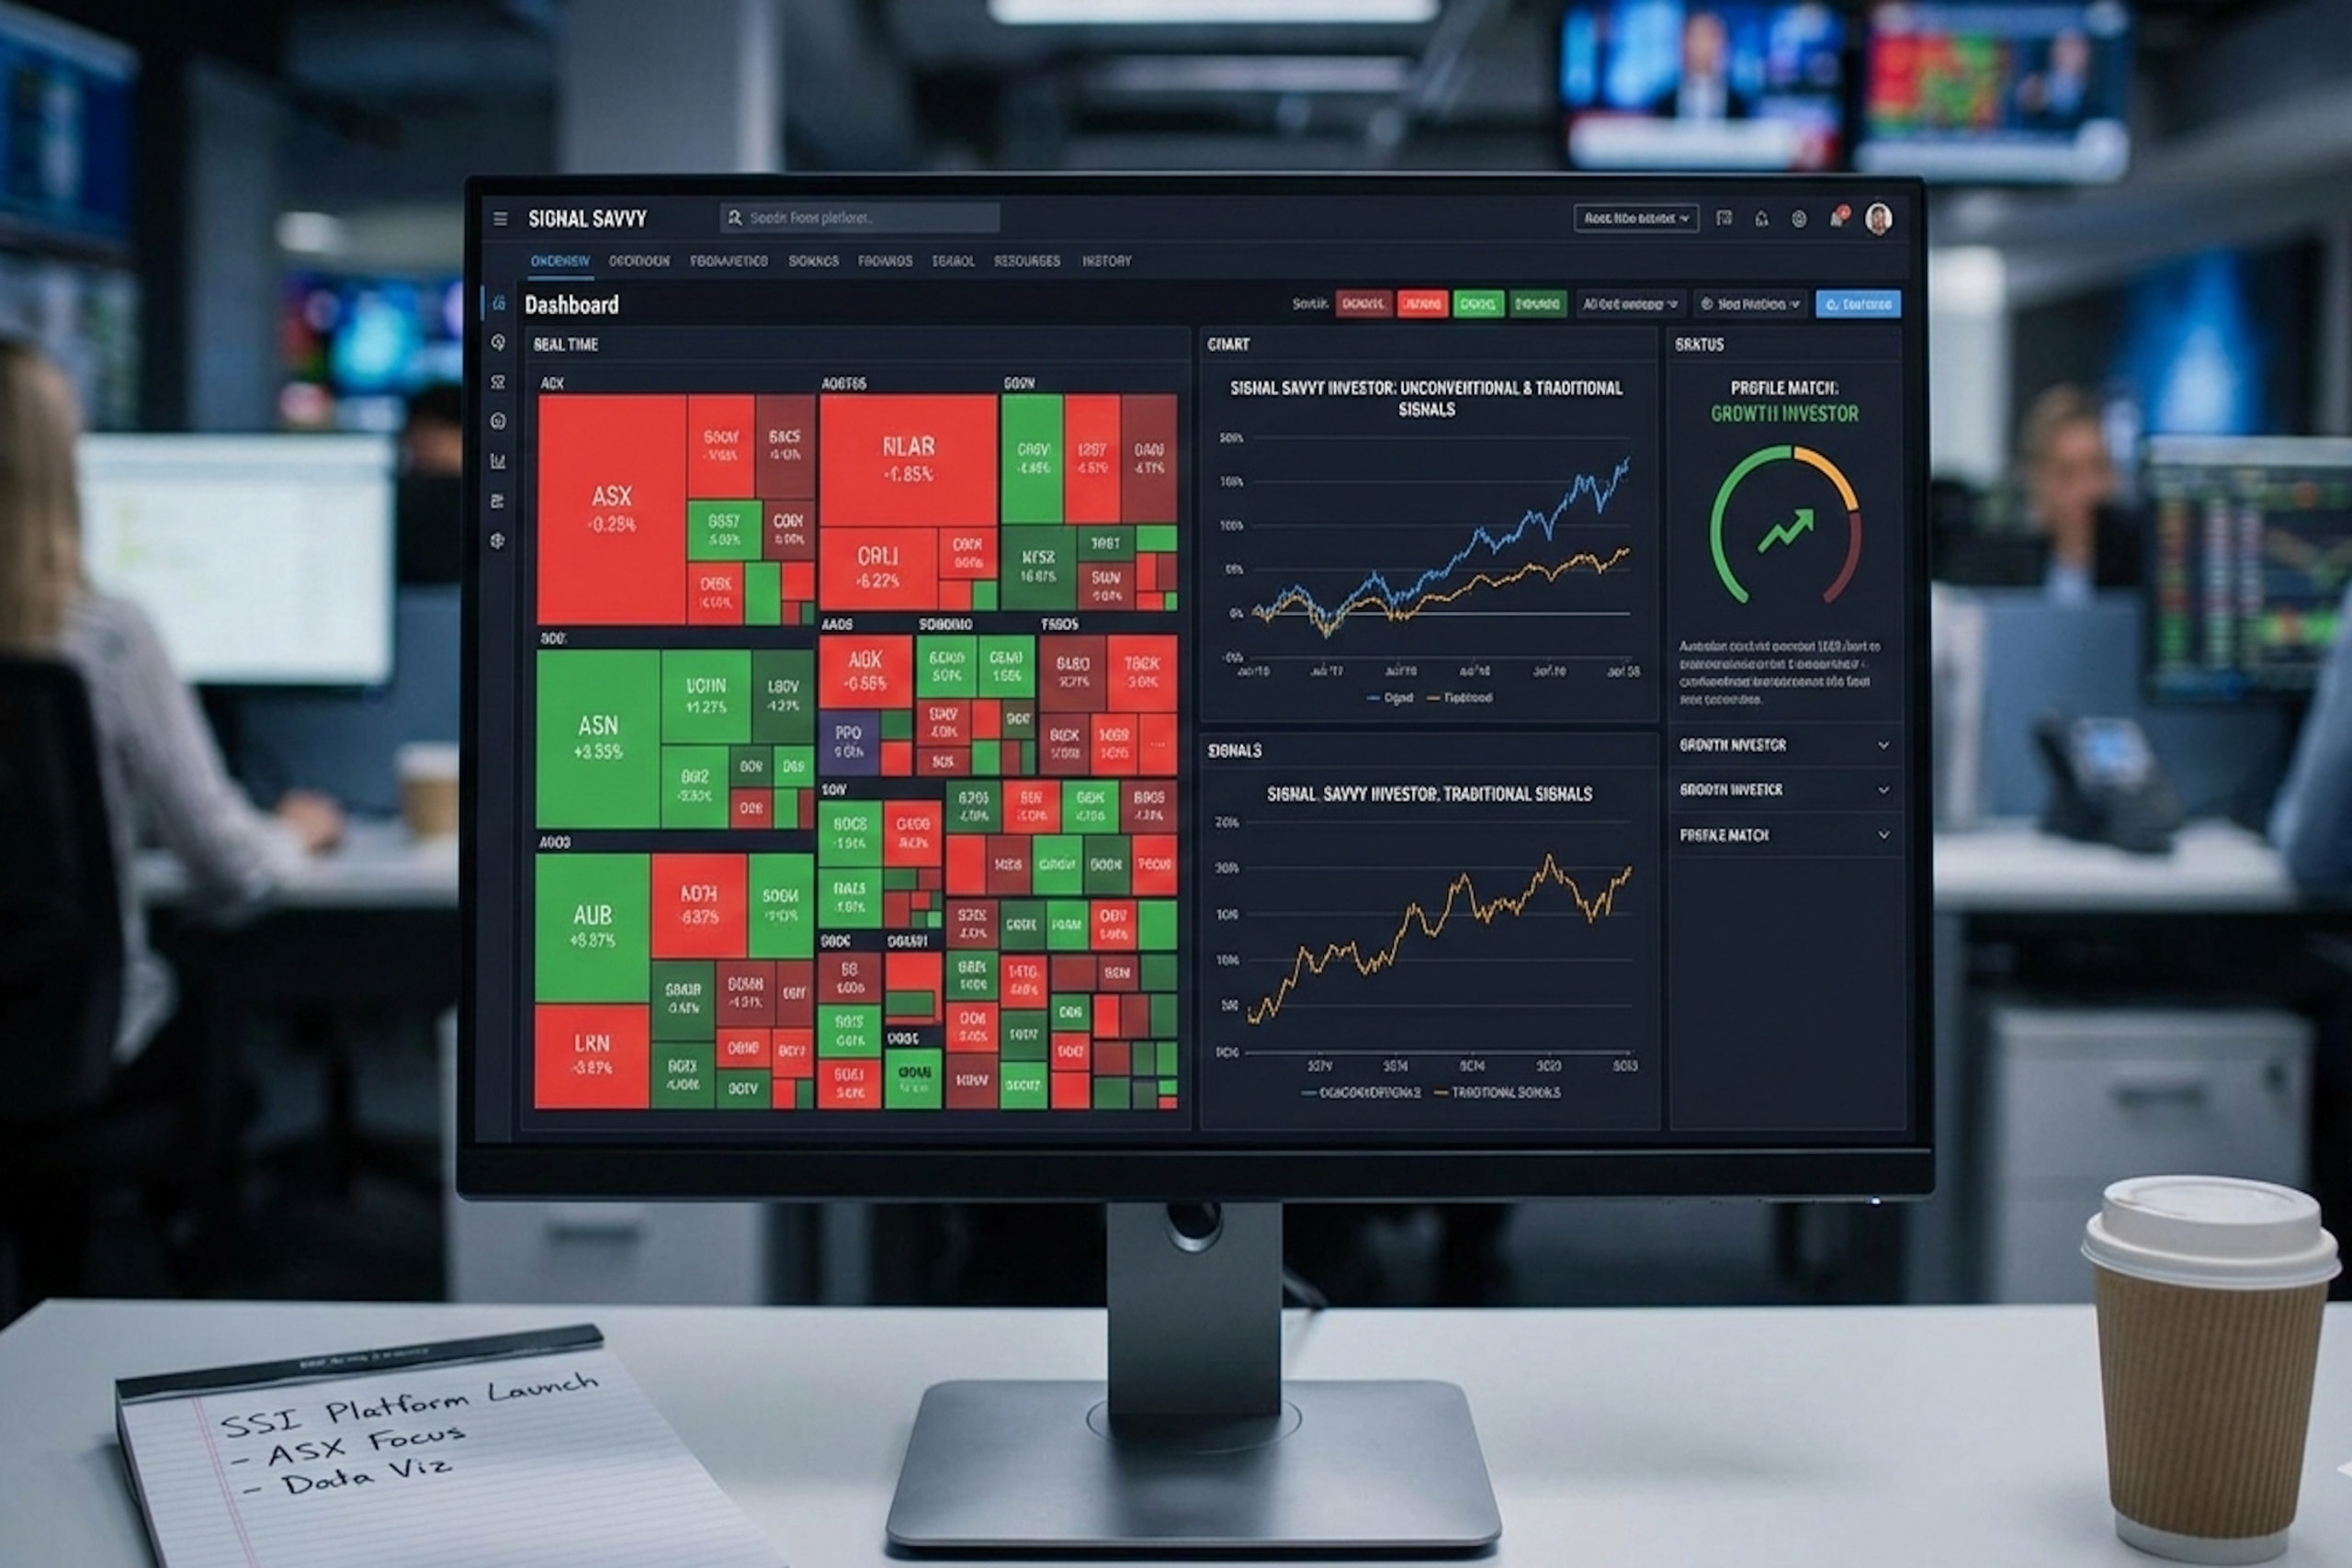
Visualizing the data on a Platform
One of the most annoying things about retail brokerage tools is that they rely on complicated spreadsheets. SSI has made high-fidelity data visualisation a top priority. Multidimensional mapping will let users see “at a glance” how a company compares to others in its industry. These charts are meant to show unusual data points and hidden gems that might be hard to find in a regular table.
Early Access and Next Steps
The Beta testing phase is almost over. As we get closer to the official launch, we’re inviting investors who want to be considered for early access.
You can do the following things if you sign up for early access:
- Be one of the first people to try out the platform’s signal engine.
- Give feedback that will help shape future updates to features.
- Get a first look at the visualisation tools and how they work.
To get on the waitlist, please fill out this form.
The time of manually and thoroughly screening stocks is coming to an end. We can’t wait to give you the tools you need to navigate the ASX like a pro!