The Reserve Bank fronts up two weeks from today, on 29 September, and traders are now pricing an 85% chance it pulls the trigger again.
That’d make four hikes in 2026. The cash rate has gone 3.60% to 4.35% this year, the Board doesn’t expect inflation back around the middle of its target band until late 2027, and Governor Michele Bullock is widely expected to signal that more tightening may be needed.
So far, so predictable.
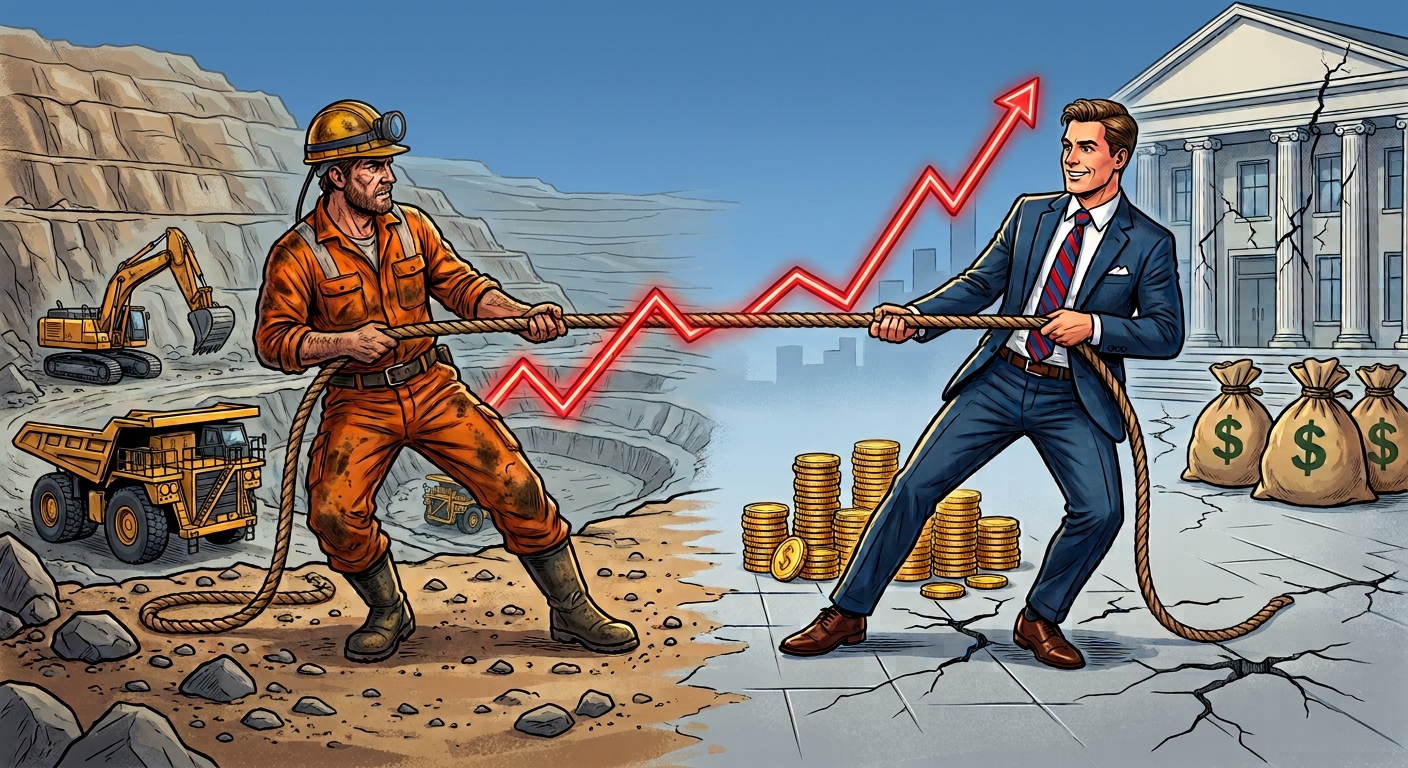
But the ASX isn’t one market. It’s two enormous bets wearing the same jersey and depending on the day, they either pull apart or fall over together. Both outcomes cost you. Just differently.
Nearly 60c in the dollar, two sectors
Financials are about a third of the S&P/ASX 200. Materials are roughly another quarter.
Do the sums. Close to 60 cents in every dollar of an ASX 200 index fund is riding on banks and miners.
That’s wild by global standards. And it wouldn’t matter much if the two blocks behaved similarly.
They don’t. Usually.
Bank earnings are built out of interest rates and credit quality. The RBA has enormous sway there. Miner earnings are built out of iron ore, copper, gold and the US dollar, over which the RBA has precisely zero influence.
So when someone tells you the market has “priced in” a hike… ask which half of the market they’re talking about.
Setting one: they split, and the index lies to you
Last Friday, BHP (ASX:BHP) copped it, down 4.1%. Evolution Mining (ASX:EVN) shed 3.8%. Northern Star (ASX:NST) gave up 3.6%. The big four banks? All higher, between 0.2% and 1.4%.
Monday, same story. Materials down another 0.55%, dragging the sector to its lowest since 5 August. Financials up 0.43%, banks adding about 0.52% as a group.
And the index on Monday? Up 8.7 points. A 0.10% gain.
That number described nobody. Not one portfolio on the continent looked like “up a tenth of a per cent” — they looked like a miner getting hammered and a bank drifting up, in whatever proportion you happened to hold them.
This is the sneaky setting. When the two blocks move opposite ways, the index goes almost nowhere, volatility readings stay subdued, and the headline number tells you everything’s fine.
Underneath, it isn’t fine. It’s just cancelling out.
Setting two: they go down together
Then there’s Tuesday.
The ASX 200 closed at 8,672.5, down 77.4 points or 0.88%, its lowest finish since 11 June. It touched 8,657.1 during the session – within a point of the 2 July low – and knifed below its 200-day moving average at 8,817 on the way.
The banks and the miners were both off more than 1%.
At the halfway mark of September the index is down 4.50% for the month, against a September average fall of 1.78%. Not a great month to be average.
So what’s different? The shock stopped being domestic.
The US 10-year Treasury pushed above 5.02% in Asian trade, its highest since 2007, ahead of a Fed meeting this week where markets lean toward a hike, with the Bank of Japan expected to move as well. Weekend calls from AI industry figures to slow development knocked the AI trade, and Australia’s commodity exposure went with it. China’s August data came in mixed: retail sales slowing, unemployment up, industrial production better.
None of that cares which sector you’re in.
And that’s the second setting. When the driver is global (for example, yields, oil, growth) both blocks fall at once, for entirely different reasons, and a portfolio split between banks and miners discovers it was never diversified at all. Just concentrated in two places instead of one.
Same thing happened on 10 September: every sector red, about $32 billion wiped off, worst session since June.
“Banks love a rate rise”. Yeah, nah
The comfy version goes: higher rates, fatter margins, happy banks.
There’s something in it. It’s also about half the story.
Higher rates also mean mortgage stress, deposit competition, weaker credit growth and house prices going backwards. Cotality reckons the current decline could be the biggest in forty years. Banks don’t just clip the spread. They carry the loan book, and a loan book sitting against falling collateral in a slowing economy is a very different animal to a margin story.
Which is why the sector got smacked through August even while hike odds were climbing.
The number nobody’s talking about
Australia’s 10-year bond yield has pushed above 5.4%, the highest since May 2011. Its US equivalent is above 5.02%, the highest since 2007.

Those are the ones to watch, and between them they get a fraction of the airtime the cash rate does.
The cash rate sets what banks pay each other overnight. The 10-year sets, roughly speaking, the rate at which the market discounts everything else. When it climbs, the present value of earnings arriving years from now falls; mechanically, whether or not the company has put a foot wrong.
Handy exercise, takes about ten minutes: go through your holdings and split them into what you own for the cash it throws off THIS year, and what you own for what it might earn in 2030.
Those two piles behave completely differently when long yields move. Most portfolios have both. Most investors have never separated them.
The diggers have a different headache
Iron ore’s hovering just under US$100/t. Gold’s around US$4,375/oz. Copper’s come off its record highs.
None of that has anything to do with Martin Place.
BUT the resources complex isn’t insulated either. It’s wired into the very thing driving the hike expectation. Brent’s pushed up near US$107 on Strait of Hormuz tensions, and if that sounds familiar it should: Bullock and Jim Chalmers both partly pinned May’s hike on the Iran conflict and the resulting oil shock.
So the chain goes: oil up → inflation expectations up → hike odds up → bond yields up → anything not generating cash today gets marked down.
Meanwhile miners cop it on input costs and banks cop it on collateral.
The RBA is flying slightly blind
Lovely detail, this one, and it’s had almost no airtime.
The ABS drops August inflation data on 30 September.
The Board meets on the 29th.
They’ll make the call the day BEFORE the freshest CPI print lands. The most recent numbers they’ll have are July’s: headline 3.5%, down from 3.8%, but trimmed mean stuck at 3.6%, both still north of the 2–3% target.
Which goes some way to explaining why the forecasters have been split. NAB, Deutsche Bank and UBS backed September early. ANZ, CBA and Westpac tipped November. All four big banks expect a hike before the year’s out. They just couldn’t agree on whether the Board waits two more weeks for better intel.
At 85% pricing, the market’s made up its mind. The Board hasn’t necessarily.
What we’re watching (and what we’re not)
We don’t forecast the cash rate. We’d be worse at it than the people who do it full-time, and they can’t agree with each other.
What our data does track is volatility regime: where a stock’s current volatility sits against its own three-year history, as a percentile. Not a prediction. Context. A 3% move means something very different at the 20th percentile than it does at the 95th.
And here’s why that matters more than usual right now. On Tuesday the ASX 200 VIX sat at 14.37 – a reading that says “mild” – while the two halves of the index tore in opposite directions. Index-level volatility gets suppressed by divergence. The calmer the headline number looks, the less it’s telling you.
Three things worth eyeballing in your own portfolio before the 29th, none of which need you to have a view on what the Board does:
What you ACTUALLY hold.
Not what you reckon you hold. Index fund plus a couple of bank shares plus a miner? Your real exposure to those two sectors is probably chunkier than you’d guess.
Where your earnings sit in time.
Cash today versus cash in 2030. Long yields are at multi-decade highs and that repricing is well underway.
Whether banks and miners are actually hedging each other.
That’s the assumption buried in a lot of Australian portfolios, and Tuesday was a reminder that it holds right up until it doesn’t.
None of this is about picking the meeting. It’s that “what’ll the market do?” is the wrong question when 60% of the weight sits in two blocks that either cancel each other out or fall over together.
There is no market. There are two of them and this week they’ve done both.
Signal Savvy Investor tracks volatility regime, sentiment and fundamentals across the ASX. We’re opening spots in our Founding Tester Program: free access for eight weeks, in exchange for telling us what’s wrong with it.
This article does not constitute financial product advice and does not take into account your objectives, financial situation or needs. You should consider obtaining independent advice before making any financial decisions.
