Australian market sentiment has slumped to “Extreme Fear”. Valuations, though, are sitting right around their long-run median. Here’s what the dashboards are saying, and why the gap between mood and maths is worth watching.
If it’s felt like a grind on the ASX lately, you’re not imagining it.
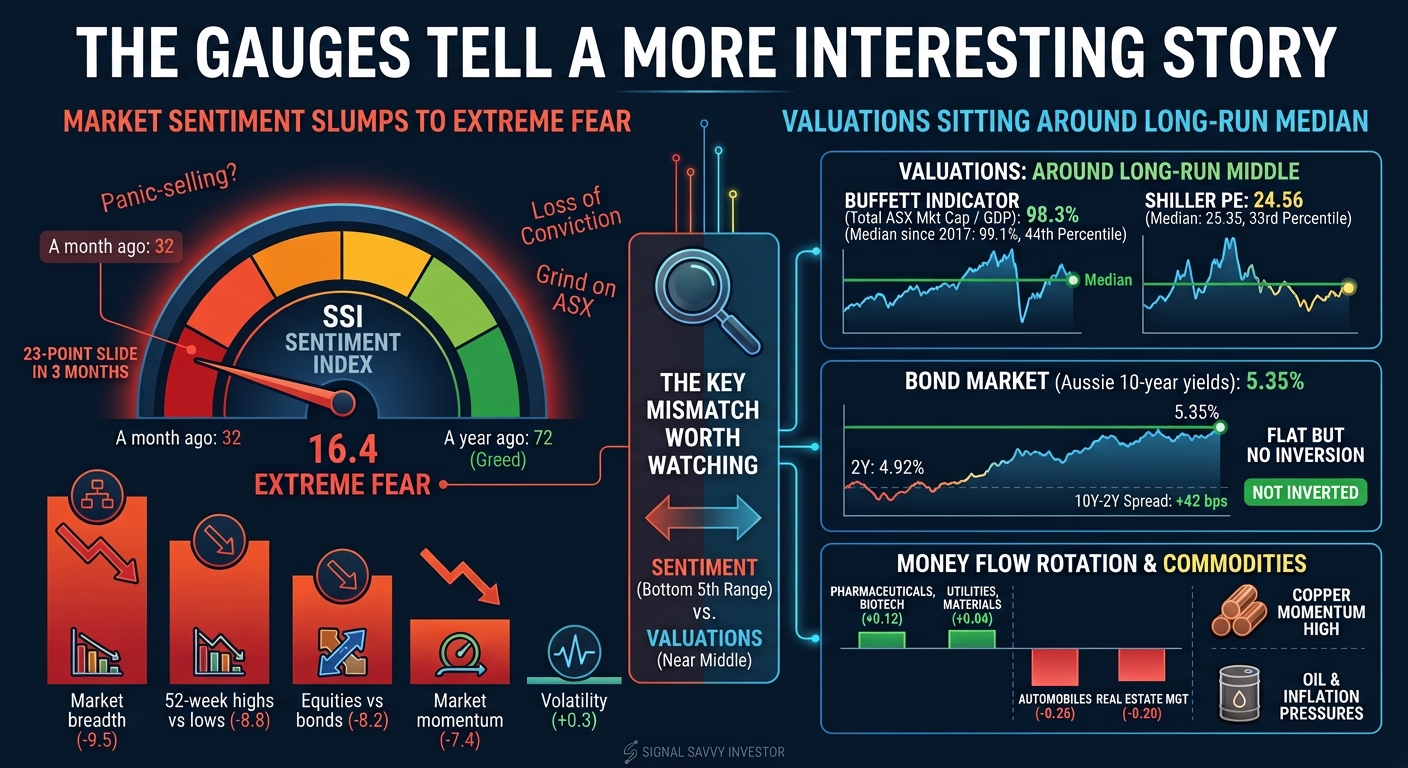
The SSI Sentiment Index for Australia closed out last week (2 October) at 16.4 out of 100.
That’s deep in Extreme Fear territory.
A month ago it was 32. A year ago it was sitting pretty at 72, firmly in Greed.
That’s a 23-point slide in three months. Punters have gone from buying the dip to wondering if the dip has a basement.
The fear gauge is flashing red
The SSI Sentiment Index for Australia sits at 16.4, down from 72 a year ago.
Source: Signal Savvy Investor.
The gauge itself is simple: 0 is maximum fear, 100 is maximum greed, 50 is a shrug.
The interesting bit is what’s under the bonnet. Four of the five components are dragging the needle down, and they’re all pulling roughly as hard as each other:
Market breadth (−9.5): fewer stocks are participating. When only a handful of names hold the index up, the rally is thinner than it looks.
52-week highs vs lows (−8.8): more stocks are hitting yearly lows than yearly highs.
Equities vs bonds (−8.2): with the 10-year bond paying over 5%, shares have a genuine rival for your dollar.
Market momentum (−7.4): the trend has rolled over.
The odd one out? Volatility, at +0.3. It’s barely moved.
That’s the curious part. This isn’t panic-selling chaos. It’s a slow, grinding loss of conviction, with breadth and momentum quietly fading while volatility stays calm.
Scared, sure. But expensive?
Here’s where it gets interesting. Fear usually goes hand in hand with a market that’s run too hot. On the numbers, that’s not the case right now.
The Buffett Indicator (total ASX market cap as a share of GDP) is at 98.3%. The median since 2017 is 99.1%. That puts it in the 44th percentile, smack on the long-run middle.
The Shiller PE (price against ten years of inflation-adjusted earnings) is at 24.56, against a median of 25.35. That’s the 33rd percentile, a touch below normal.
So sentiment is in the bottom fifth of its range, while valuations sit near or slightly under their middle.
That gap doesn’t tell you where the market goes next. Fear can get more fearful, and cheap can get cheaper. But it’s exactly the kind of mismatch that’s worth knowing about, and you’d miss it if you only looked at one dial.
The bond market isn’t sounding the alarm
Aussie 10-year yields have climbed to 5.35%, with the curve flat but positive at +42 basis points. Source: Signal Savvy Investor.
Remember that “equities vs bonds” drag? This chart is why.
The Aussie 10-year yield is at 5.35%, the 2-year at 4.92%. Both have been climbing all year. When a government bond pays north of 5%, the bar for shares to earn their keep goes up.
The gap between the two, the 10Y–2Y spread, is +42 basis points. The curve has been flat since March but hasn’t inverted, the classic recession warning. The last time it went negative was a brief stint from June to July 2023.
The read: rates are high, but the bond market isn’t pricing in a downturn. That’s another dial telling a calmer story than the sentiment gauge.
Follow the money (and the metal)
Fear doesn’t mean everything’s getting sold. Under the surface, money is rotating.
SSI’s industry money-flow tracker measures turnover-weighted buying and selling pressure over the past four weeks. Pharmaceuticals, biotech and life sciences led the inflows (+0.12), with Utilities and Materials (both +0.04) also in positive territory. That Materials reading rests on 123 stocks, so it’s not a fluke of one or two names.
On the other side of the ledger, Automobiles & Components (−0.26) and Real Estate Management & Development (−0.20) saw the heaviest outflows. A word of caution: some groups rest on only a handful of ASX tickers, so a single big trade can swing them.
The Materials flow fits the commodities picture. Copper is at 13,543 USD a tonne, and SSI’s Industrial Metals Momentum signal reads 81.1, firmly “High”. For a market as resources-heavy as ours, that’s a tailwind worth keeping an eye on, even when the broader mood is sour.
Energy is the flip side. With Brent crude at 114 USD a barrel, oil is the single biggest contributor to SSI’s inflation pressure reading right now. That feeds straight back into rates, bonds, and round we go.
One dial is a guess. Five is a picture.
Put it all together and you get a market that feels worse than it measures:
Sentiment: Extreme Fear (16.4)
Valuations: around the long-run middle (Buffett 44th percentile, Shiller PE 33rd)
Bonds: high yields, but no inversion
Money flow: rotating into materials and health, not heading for the exits
None of that is a call on what happens next. What it shows is why looking at one number in isolation can lead you astray, whether that’s the headline index, a scary news alert or a single chart on social media.
That’s the idea behind Signal Savvy Investor. It’s a subscription analytics platform built specifically for ASX investors. It puts the SSI Sentiment Index, valuation gauges, the yield curve, inflation, commodities and money flow on one dashboard, alongside stock-level screening, rankings and seasonality tools.
No tips, no hot stock calls. Just the dials, so you can make up your own mind.
Data as of 2 October 2026. This article is general information only and does not take into account your objectives, financial situation or needs. It is not financial advice or a recommendation to buy or sell any security. Past performance is not a reliable indicator of future performance. Consider seeking independent advice before making investment decisions.


Leave a Reply